Free
$0
forever, for learning and personal work
- Watermarked exports
- 5 runs a week
- 1 m sensor grid
- Every export format
- Nothing to install
Drop a model, run a full year of hourly sky on it, and read sDA and ASE as a colour map on each floor. Design-stage screening, not certification — and the grid goes back into Rhino.
Free to try, no account for the preview. First result under 5 min.
Screening, not certification
LEED-style sDA and ASE to choose between options; a stamped study still needs a validated engine.
A full year, hour by hour
Runs the site's weather file, or falls back to a steady-state CIE-overcast Daylight Factor.
Read the whole floor
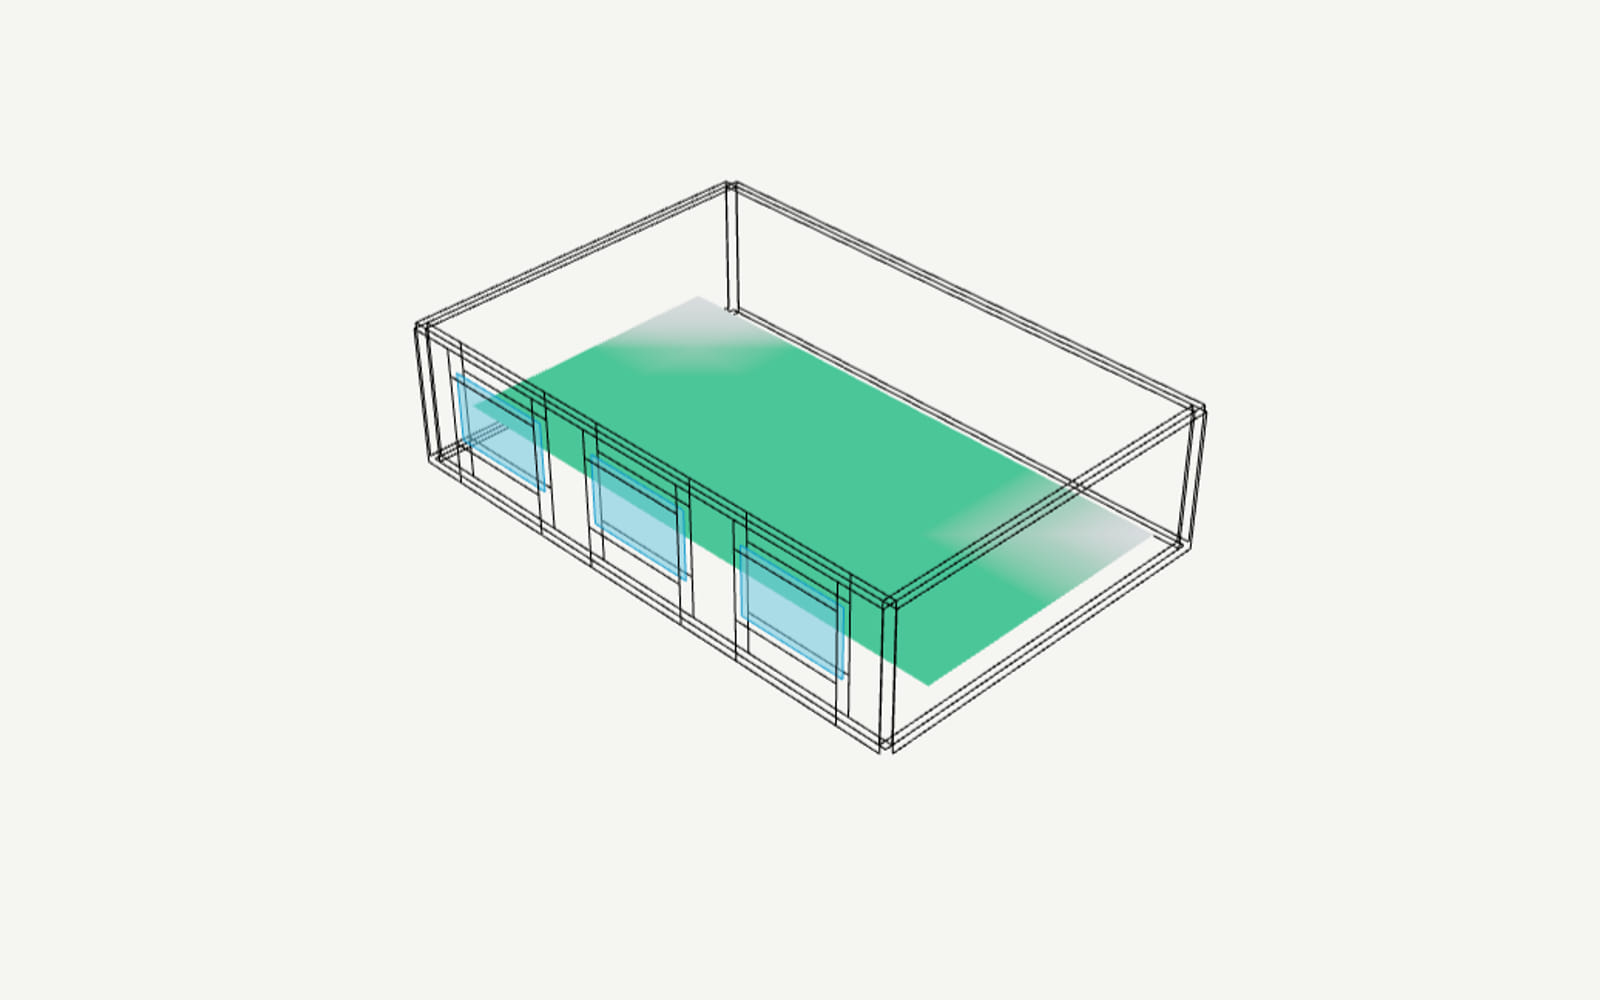
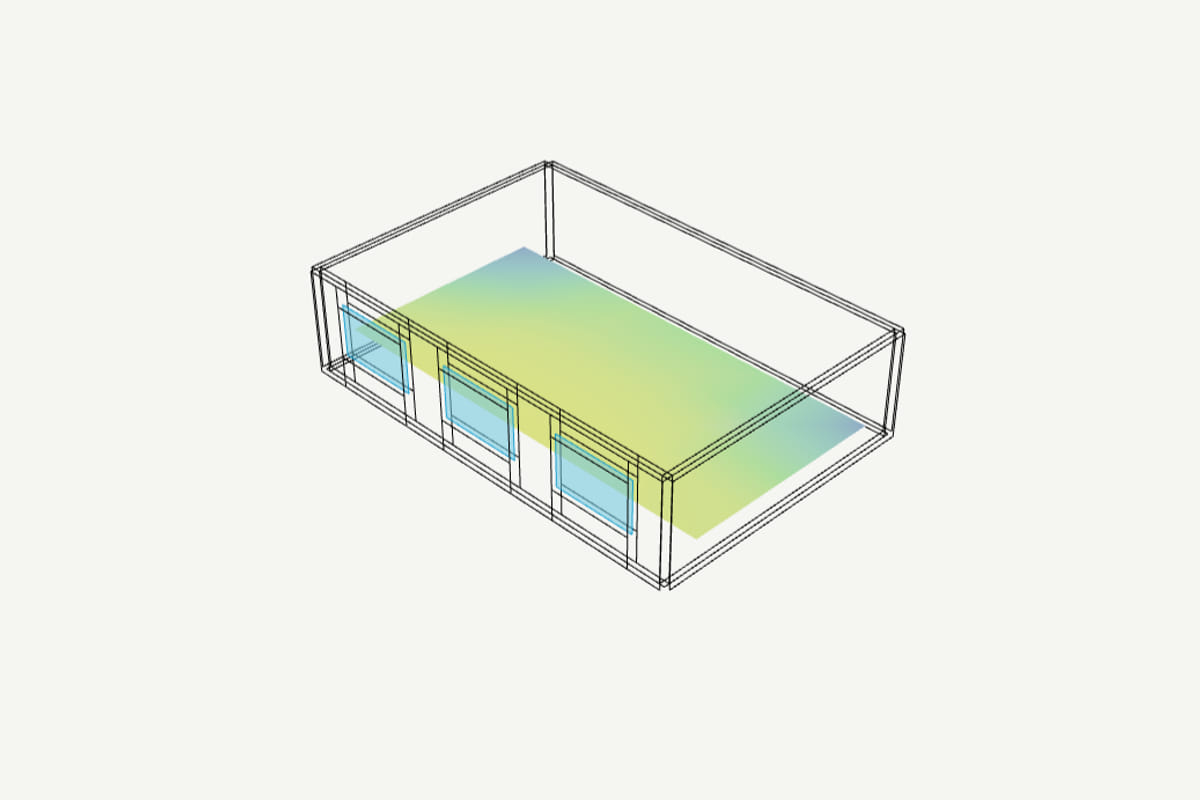
One colour map per storey, with the bright, the dim and the glare-prone zones marked.
Runs in your browser
The model is parsed locally. It leaves for Rhino or Revit only when you choose that export.
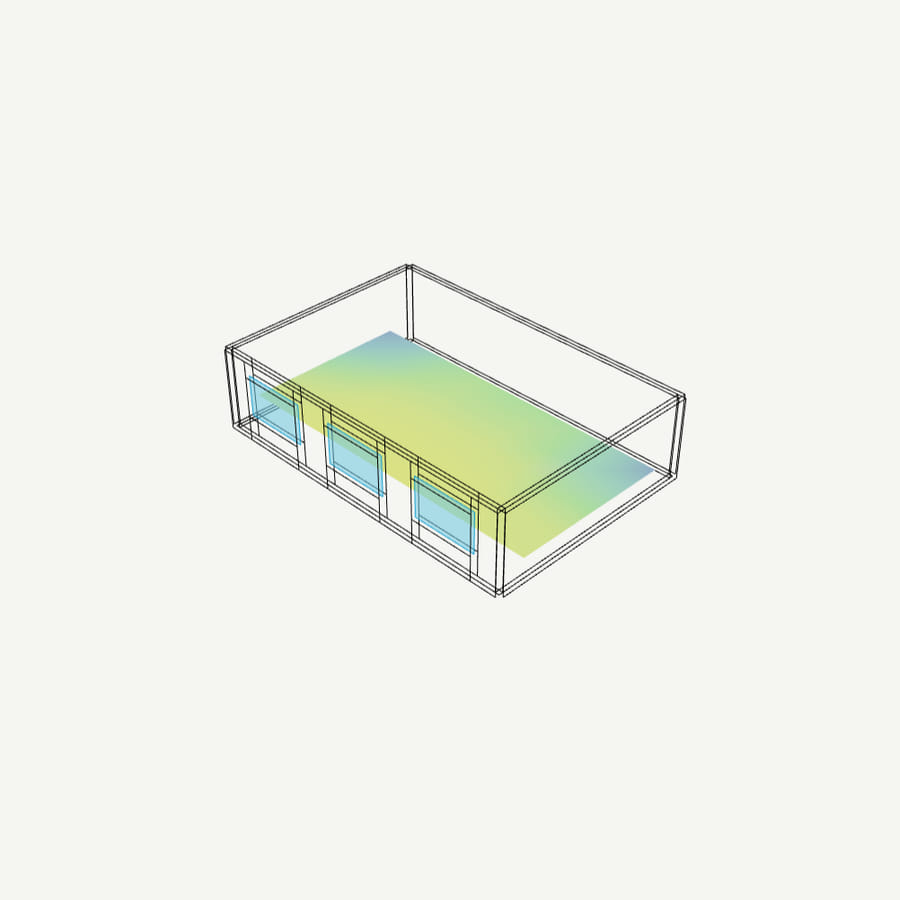
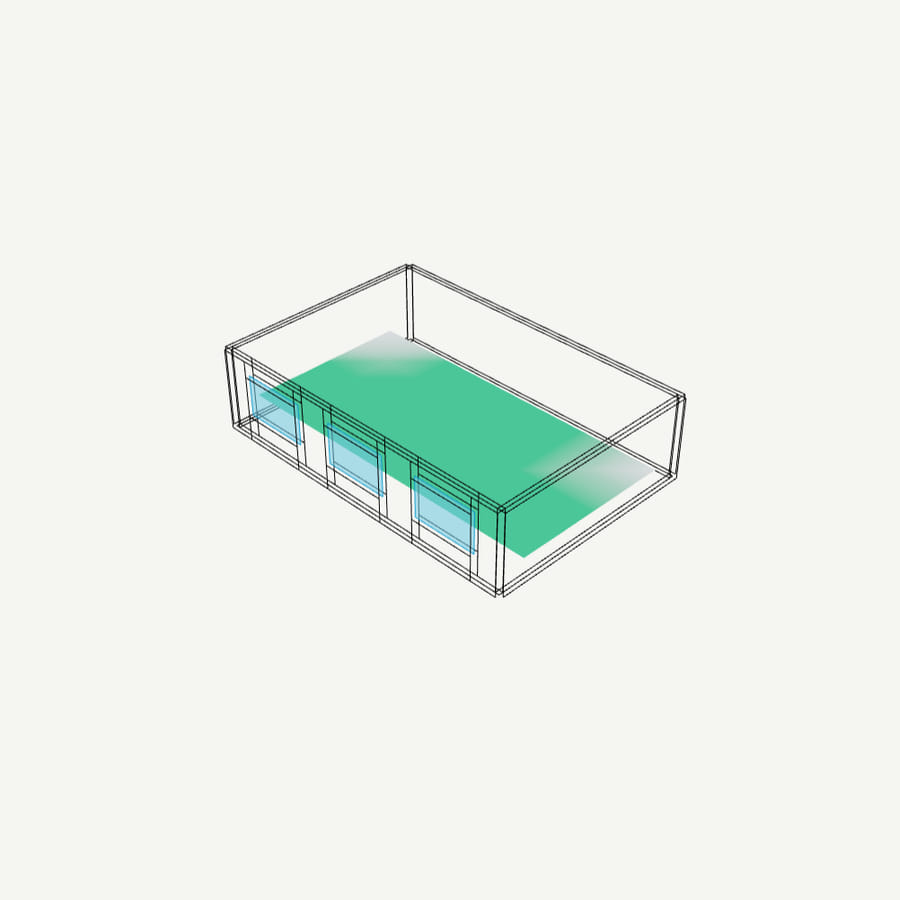
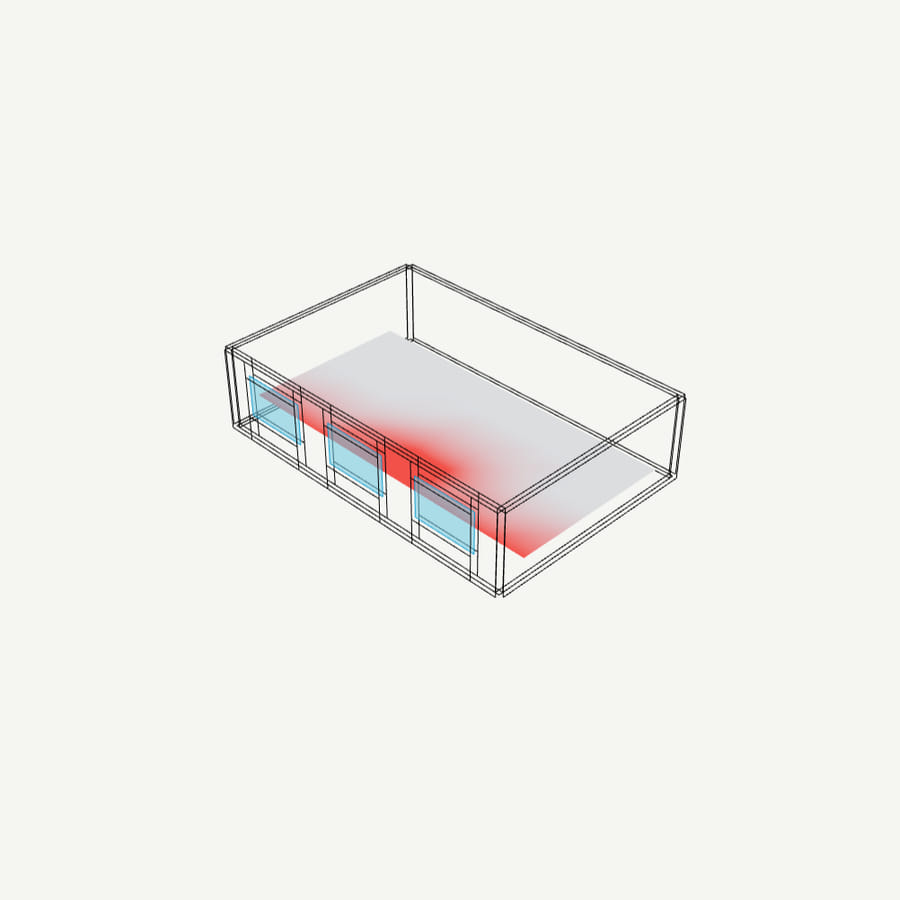
The same model, three of the readings.
Result views
The same floor read three ways: the annual daylight map, the sDA pass area (enough daylight for enough of the year) and the ASE area (too much direct sun). Alongside them, the glare timeline and the per-floor and per-window breakdowns.
Switch a reading on and the map changes with it — no second run, no export. The per-sensor values behind it are the same ones the PDF and the CSV report.
sDA pass area
Where the floor holds enough daylight for enough of the year
ASE glare area
Where direct sun runs over the over-bright threshold
By floor, by window
Which storey and which opening is doing the work
Open a sample
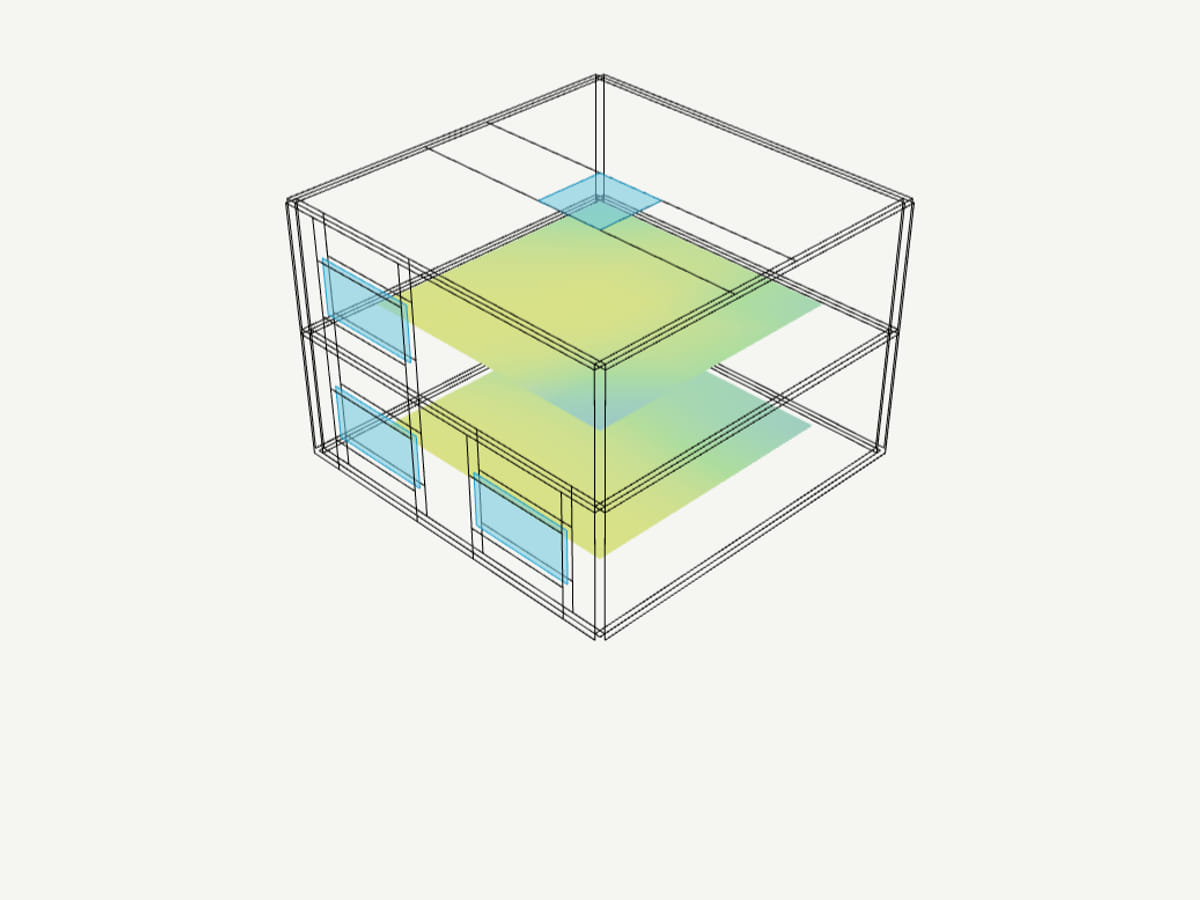
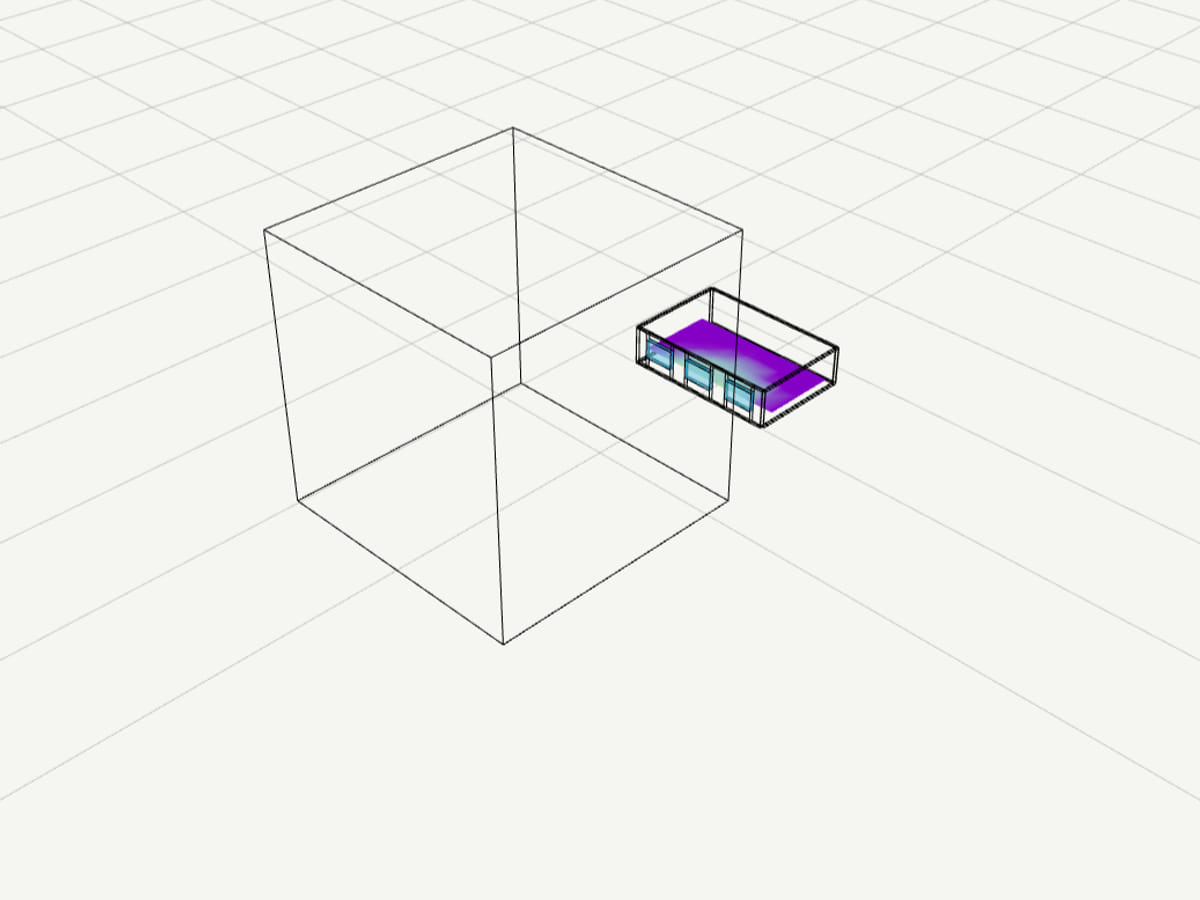
Three sample rooms to try before you bring yours: a side-lit office, a two-storey room with a skylight, and an office across the street. The tool takes your own .3dm, .obj, .fbx or .ifc — opening a sample loads it exactly as a dropped file would, and nothing runs until you press Calculate.
Plans
Run and read for free. Pay when the practice needs unlimited runs, a finer grid and a clean report.
Free
$0
forever, for learning and personal work
Pro
$19
per month, or $190 a year
Education
Free
with a verified academic email
Limits shown are the live ones for this tool. Free and Education are for learning and personal exploration; client and commercial work needs Pro. See the terms. Want the method and its limits? Read the tutorial.
Export formats
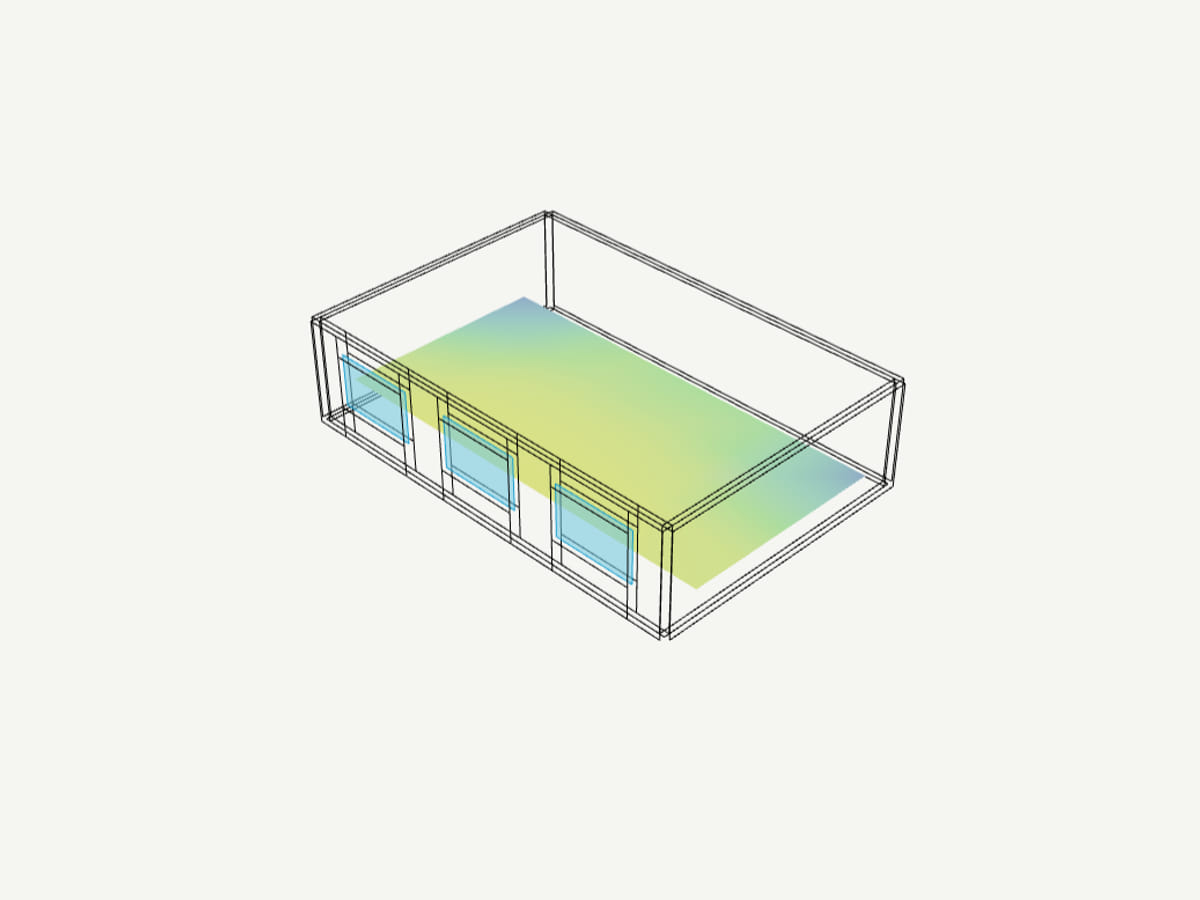
The result leaves as a one-page PDF for the meeting, the sensor grid as CSV for a spreadsheet, and the coloured grid back into Rhino as a .3dm with the run's settings on the root layer.
Opens in Rhino and Revit, and the CSV in any spreadsheet.
Rhino
The coloured result grid as a .3dm on its own layers, or baked straight into the open document from the panel.
Revit
Per-sensor results in the model's own frame, carried back through the add-in.
Your model
A PDF for the meeting
One page: the map, the headline daylight readings and the settings the run used.
A spreadsheet
Every sensor's value, one row each, for your own charts.
How it works
In your browser, and back into Rhino or Revit.
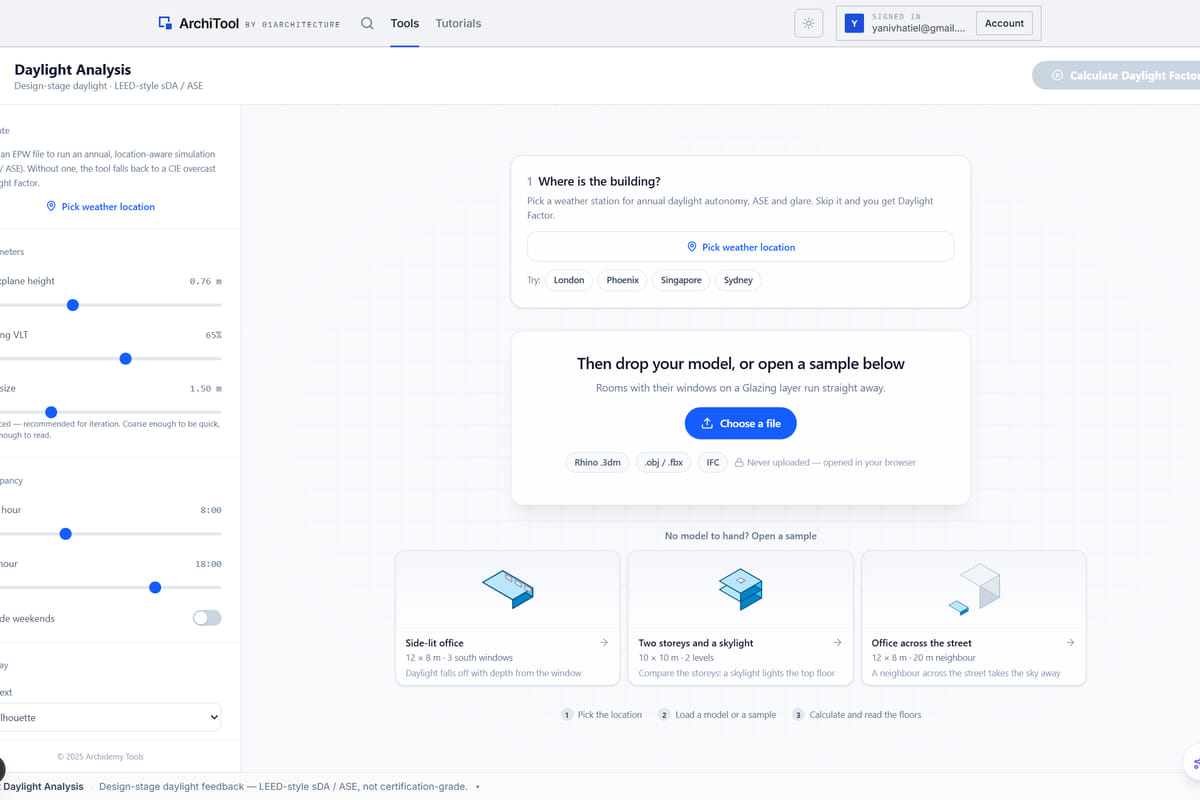
01Drop the model
A .3dm, .obj, .fbx or .ifc. Floors and glazing are recognised from layer names; fix the rest in one click.
02Calculate
Pick the weather file and the storeys to measure, then run. Every hour of the year, nothing uploaded.
03Read it, take it back
The floor map and the per-floor, per-window readings, then the grid back into Rhino or Revit as a working file.
FAQ
Everything about data, formats and plans. Still curious? The tutorial goes deeper, and the Report button inside the tool reaches us.
sDA is the share of occupied hours a point spends at or above the target illuminance; ASE counts the hours it sits in direct sun above the over-bright threshold. We report LEED-style sDA and ASE for design-stage screening — the standards are named, not scored here.
No. It is design-stage screening: the same method a validated engine uses, deliberately simplified for browser speed, and checked against Radiance on room, skylight and deep-plan scenes. Trust the relative reads — option A against option B, which rooms are dark, which window does the work. A stamped study still needs a validated engine.
A Rhino .3dm, an .obj or .fbx, or an .ifc, with floors, walls and windows on named layers (or named objects). Layers named like Floor, Slab, Glass or Window are assigned for you, and a file you have opened before keeps its roles.
For annual sDA, ASE and the glare timeline, yes — an .epw for the site. Without one the tool falls back to a steady-state CIE-overcast Daylight Factor, a ballpark to get the massing right.
More runs, a finer sensor grid, a clean PDF and the AI Advisor inside the tool. Every analysis and every export works on every plan. The plans below show the current limits.
No. The model is parsed in your browser. It goes to Rhino as a .3dm download or to Revit through the add-in only when you choose that export.
Yes. The Options tab keeps runs side by side, and every reading is per floor and per window, so you can show which opening is doing the work before the drawings are fixed.
A daylight map of every floor, from the massing, in the time it takes to make coffee.